GW DOS calculations using QE and YAMBO

In this short tutorial I will show how to first perform a QE calculation of the molecule benzene in a vacuum box at the GGA level. Then, we will use YAMBO to calculate a single shot G0W0 correction to the Kohn-Sham eigenvalues. As a last step we calculate the density of states at the GW level as well as a projected density of states on the C:s orbitals.

The main purpose for this tutorial is to demonstrate the work-flow based on instructions by Daniele Varsano (here).

I will assume, for the sake of keeping this tutorial short, that one already knows the basic steps of creating the base folder for a YAMBO calculation by first performing an SCF and NSCF calculation. The crucial step for the GW-PDOS calculation is to perform a PDOS calculation using projwfc.x before creating the YAMBO base folder in p2y. That means the proper sequence is: scf (pw.x) > nscf (pw.x) >pdos (projwfc.x) > p2y > yambo initialization > yambo G0W0> ypp. After the p2y step there should be a new file in the base folder called ns.atom_proj_pwscf – this basically indicates that p2y found atom projections and created a database.

As always: this is a basic example and not a converged calculation (this will become obvious right away)

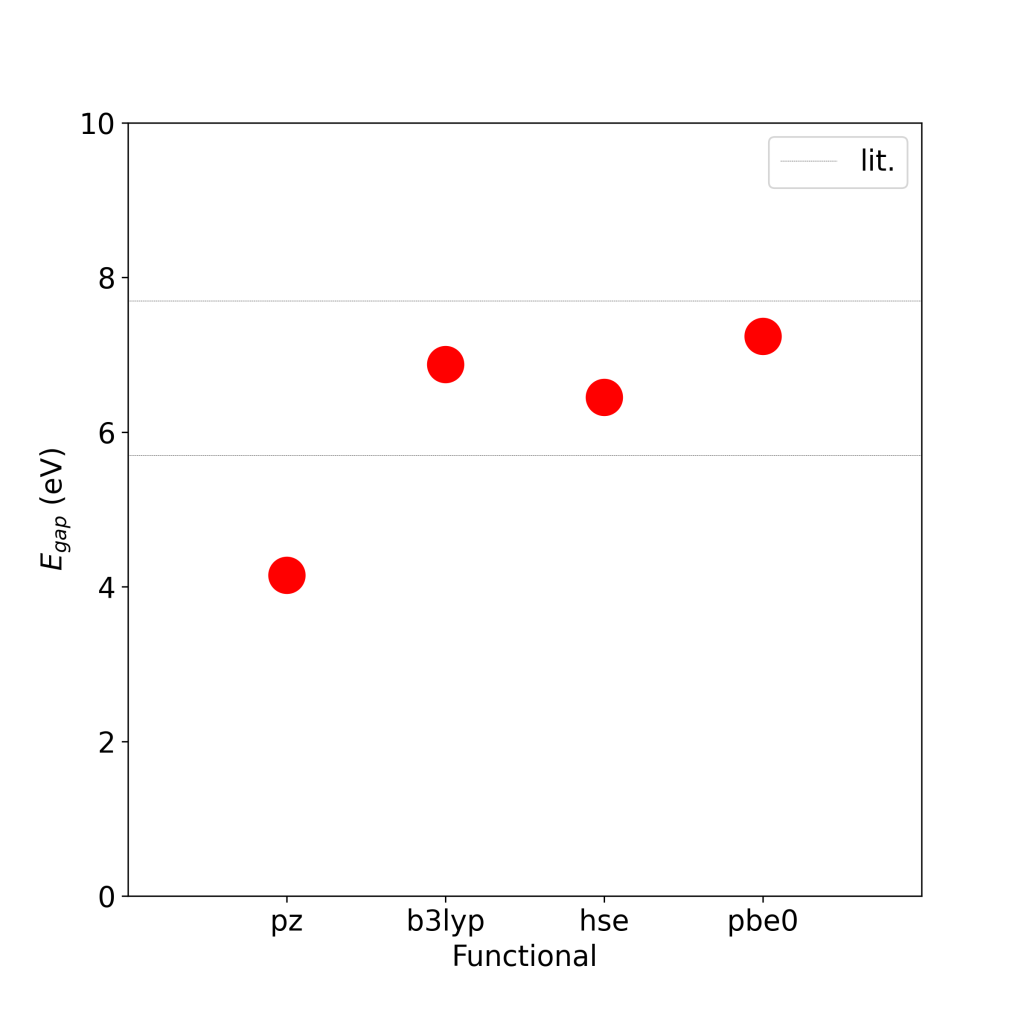
Let’s first see what the G0W0 (yambo -x -p p -g n) calculation does to the eigenvalues:

As you can see in above plot of the o.qp file, the gap between the highest occupied molecular orbital (HOMO) and lowest unoccupied MO (LUMO) at the GGA level is around 5 eV. This increases to around 8 eV at the G0W0 level (shown in red). A converged GW gap for this molecule is around 10 eV. [1]

Ignoring this discrepancy for now we move to the generation of a DOS input using ypp -s s -V all, increasing the verbosity to all helps with defining the input. A few lines deserve special attention:

To tell ypp that we attempt to create atom projected DOS we change the project mode line to: PROJECT_mode= “ATOM”. By itself, the GW corrected database will not be read, therefore the line related to that reads: GfnQPdb= “none”
last but not least you will see a larger block at the bottom of the file related to selecting atomic wave functions – I will come to that in a second.

To find out which atom types and wave functions are in our calculation we can take a look at the report generated during the initialization of the calculation:

  [02.01] Unit cells
  ==================

  Cell kind             :  CUB
  Atoms in the cell     :  C  H
  number of C  atoms    :   6
  number of H  atoms    :   6

  List of atomic masses
  Mass of C     :  12.01070
  Mass of H     :  1.000000

As we can see, there are two types (C, H) and 6 atoms each (C6H6). The H pseudo potential will contain the 1s wave function with angular quantum number l=0, C will contain the 2s (l=0) and 2p (l=1). If we don’t care about the type of atom and wave function we can just leave them set to -1 and run ypp. This will generate the total DOS at the GGA level.

Advancing one step, we can insert the QP corrections by replacing GfnQPdb= “none” with

GfnQPdb= "E < ./SAVE/ndb.QP"

Note that the ndb.QP can also lie in a different folder if the GW step was called using a job identifier (-J)! The default folder is however SAVE. Running ypp one more time will now tell us in the output that it will apply corrections to the eigenvalues:

[QP_apply] Action to be applied: E<./G0W0/ndb.QP[ PPA@E  27.21138 * XG 949 * Xb 1-100 * Scb 1-100]

The last but very interesting step is to not calculate only the total DOS but select a specific atom type and angular character, for example the H:s or C:s or C:p. This can be done by changing the part at the bottom of the ypp input file:

% PDOS_kinds
1 |1 |

Allows us to project onto the first type of atom, which is carbon. The next setting

% PDOS_l
0 |0 |

Allows us to project onto the s (l=0) orbital of that atom. More fine-grained selections can be defined. The resulting data can be summarized in the following DOS plot

Shown are the GGA DOS (blue), which exhibits a significantly smaller gap than expected, the G0W0 DOS in orange as well as the C:s projected G0W0 DOS in green. Note that the DOS is aligned so that 0 eV corresponds to the highest occupied orbital.

A script to run the calculations and produce the plot (using gnuplot) is attached – have fun reproducing the results yourself!

[1] Neaton et al., https://arxiv.org/abs/cond-mat/0606640

Hybrid band structure calculations (QE 7.0 update)

Dear all,

I have received several emails and comments reporting issues with the pw.x + open_grid.x + wannier90 approach for band structure calculations with hybrid XC functionals. I decided to quickly test the latest version of QE and found that all is well – at least for my simple test case.

The attached run file will let you calculate the bands of bulk MgO with hybrid functionals (I tested HSE, B3LYP and PBE0 but that choice was entirely arbitrary and does not reflect any meaningful selection). I also tested that both, norm-conserving (ONCV) and ultrasoft/PAW pseudopotentials work at this stage and found no problem.

Below you will see the bands obtained for the ONCV case – note that this is just a test of the code’s capabilities and not converged (wiggles in the bands indicate that the wannierization failed to localize the states sufficiently which might require adjustment of the wannierization window)

And we can also quickly check if the hybrid functionals do what we expect them to do – fix the “band-gap problem”. Indeed, we find that the band-gap is increased from the PZ case (~4.1 eV) to a maximum value of 7.2 eV (using PBE0) – with literature values usually falling between 5.7 and 7.7 this is not a bad match at all 🙂

As always, use these with caution and make sure your calculations are converged! A run script that tests above-mentioned cases as well as an example of the output for HSE using ONCV pseudopotentials are available for download below.

Have fun!

Fatbands with spin-orbit coupling

A recent question touched on the case of fatband representation when spin-orbit coupling is included in the calculation (lspinorb = .true.). I assumed that this would be straightforward and indeed there is no problem up to the last step, where plotband.x should read the band energies and projections. It seems that in QE 6.5 the projection file is not properly read

 Input file > bands.dat
Reading 30 bands at 401 k-points
file with projections not compatible with bands
Range: -5.6460 34.2420eV Emin, Emax >

However the projection file is correctly written as we can identify the (j,mj) blocks such as

1    1  Pb  5D     1    2  2.5  -2.5

To circumvent this incompatibility of plotband.x one can simply read the energy eigenvalues from the bands.x outfile and relative weight of the wave-function from the projection file, where every block looks something likes this:

    9    1  Pb  5D     2    2  1.5   0.5
       1       1        0.5475316611
       1       2        0.2162196288
       1       3        0.1468317944
       1       4        0.0885236565
       1       5        0.0000000000
       1       6        0.0000000000
...
     401      29        0.0000000000
     401      30        0.0000000000

The first column is the k-point index, followed by the band and the weight for each mj state. If we want to plot the fatbands for all the d-states we have to identify the “block” number (i.e. the preceding 9 in the example above), collect all the d-states projections and plot them on top of the d-bands. I found a script in the usergroup and the origin seems to trace back to https://yyyu200.github.io/DFTbook/ but unfortunately I can’t read Chinese and cannot verify that information.

And there we have it: fatband representation for the d-bands of bulk lead with spin-orbit coupling.

A script that does all of this automatically is as always included, the pseudopotential used is the fully relativistic version of the ONCV pseudopotential which seems to be giving reliable results according to SSSP, however I did not converge the calculation as this seemed precise enough for a quick demonstration.

I hope that helps!

Five easy ways to visualize xsf volume grids

Post-processing of the total charge density allows the visualization of many quantities such as charge density, spin-polarization, electron localization and many more (see the option plot_num in the manual). In many cases the resulting data will be a 3D grid representation (voxel grid) in either the CUBE format or XSF – I prefer the latter because I am more familiar with using it.  

For this example I generated an xsf file of the spin-polarization (plot_num=6) of a molecule (I used nickelocene as an example as I had it readily at hand). By default, pp.x will generate the xsf on the entire FFT grid, which might be bigger than necessary. To avoid this, you can use “bspline” interpolation together with output_format = 3 which seems to work without any issue in QE 6.5. 

The format of the xsf file is pretty self-explanatory and also detailed here. The header contains information about the cell dimensions, the coordinates of the atoms in the cell, followed by the grid specifications and the grid data “one pixel at a time”, which are written as explained in the link as follows:

write(*,*) $ (((value(ix,iy,iz),ix=1,nx),iy=1,ny),iz=1,nz)

Now, let’s move on to how to visualize this data. The most “natural” way would probably be using xcrysden, which is excellent when dealing with xsf files, but I wanted to use MATLAB first to get a better feeling of how to read the xsf raw data so let’s look at a simple MATLAB script to read and visualize xsf voxel data first. 

1) MATLAB (https://www.mathworks.com/

Reading in the voxel grid is rather easy; I opted to look for the keyword DATAGRID_3D_UNKNOWN first and then simply read in all following lines starting 6 lines after the beginning of the datagrid. There might be much better ways of doing this, but it was all I could come up with in 5 minutes or less. In the end we have to reshape the data which can be easily achieved by MATLAB’s own reshape routine. Isosurfaces can be constructed (and simultaneously plotted) by the isosurface() function. The script to read the xsf file and create the following plot is attached at the end of this post.

I have centered the molecule at (0/0/0) for plotting purposes and I would say the result isn’t bad for such a simple approach! If someone wants to manipulate or use the data to calculate volume overlaps or similar then MATLAB is definitely convenient, but when it comes to creating pretty plots I am not sure how much this can be improved. So let’s move to option  

2) XCRYSDEN (http://www.xcrysden.org/

It does not get much easier to read and visualize xsf files than with xcrysden. Simply call xcrysden with the — xsf  switch (I am using xcrysden 1.6.2 on Ubuntu), press a to activate anti-aliasing to make it  a bit prettier and click on Tools -> Data Grid -> OK; input the isovalue, check to render positive and negative isovalues and you are ready to go; Unfortunately exporting the resulting file to an image is a bit limited and the pixel based images (png, TIFF etc.) are not the prettiest and their resolution is limited to the screen resolution. However, this is definitely a fast and convenient way. 

3) VESTA (http://jp-minerals.org/vesta/en/

Slightly nicer plots can be made with next to no effort in VESTA as well. Just drag and drop the xsf file into a recent version of VESTA (I use version 3.4.4 dated March 2018) and adjust the settings under “Properties -> Isosurfaces” to your liking. What I particularly like in VESTA is the easy slicing using the “Boundary -> Cutoff planes -> new) function. To get a better resolution, export the raster image (File -> Export raster image) at larger sizes, then shrink it down.

4) OVITO (https://www.ovito.org/

I have only used this one for a short period of time compared to the others but OVITO (Open Visualization Tool) is hands down my favorite. The following plots were made with version 3.0.0 and there is also a “Pro” version available that will come with license costs in the near future. Simply drag-and-drop the xsf file into the main window, then add a “Create isosurface” modifier (Add modification -> Visualization -> Create Isosurface); do this twice, once for positive and once for negative values of the isosurface and you are ready to export the raster image with a render engine of your choice.  Here I have used Tachyon which already gives quite nice results.  

The GUI offers a huge variety of customizations for atom color, radius, bond customization, slicing (Add Modification -> Modification -> Slice) making this tool really fun to work with. But if you want to go one step further you can use… 

5) OVITOS 

OK, I admit, this is not really another tool but rather the python scripting interface to OVITO. Nevertheless, this is an amazing addition that makes repeated tasks much less annoying. When using the script interface you can further take advance of numpy which makes “doing math” on the xsf file very easy. This approach really shines when you have to create a lot of similar plots for a publication and you want to make sure that plotting is consistent across these plots (for example atomic radii or colors). I have attached the python script used to create this plot which I hope is basically self-explanatory. 

 If you have any questions drop them in the comments and I will try to help you out! 

Happy Plotting! 

Phonons using PWSCF and Phonopy

First of all happy new year to everyone! I have received a lot of positive feedback on my posts and I apologize when it takes me a long time to get back to you – my new year’s resolution for 2020 is to post and reply more frequently 😉


Today I want to show two different ways of calculating phonons for molecules. The first one is by density functional perturbation theory (DFPT) as implemented in PWSCF using ph.x, the second one is by finite differences and using phonopy. Generally DFPT is fast and reliable but in the current version of PWSCF (6.5) it is still limited and can’t do hybrid functionals for example. This is where phonopy comes in. In the finite difference method the the equilibrium geometry is distorted, then a self-consistent calculation (pw.x) is performed and in the end all the forces are collected. This means that this method can be used whenever pw.x can be used which includes hybrid functionals (keyword input_dft=’HSE’). However finite differences cannot calculate the dielectric tensor or effective charges for which we are still limited to ph.x.

Benzene in a box


To calculate a molecule in a plane-wave code one uses the “molecule in a vacuum box” setup, where the molecule is sufficiently far away from its periodic images and this “isolated”. The size of the vacuum box needs to be converged but I find separations of about 15 Angstrom to be usually sufficient. This is shown on the right hand side where one periodic image in z-direction is included to emphasize the intrinsic periodic nature.

There are a few limitations of how the phonopy code reads the PWSCF in file and generates the displacement patterns.

  1. The only supported Bravais lattice option is currently ibrav=0, which means that the CELL_PARAMETERS have to be input manually
  2. CELL_PARAMETERS have to be in Bohr units but can be converted from angstrom. However, be aware, phonopy currently only detects angstrom and not {angstrom} or (angstrom) – which are fine for PWSCF so be careful.

The workflow is as follows:

BORN file format
Description of how to convert the ph.x output into the phonopy BORN file

A) on GGA level perform a pw.x SCF calculation using occupations=’fixed’ followed by a ph.x DFPT calculation where epsil = .true. . This will give the dielectric tensor as well as the effective charges which will serve as an input for phonopy calculations. The have to be copied in a file called BORN in a certain format (which will be done automatically by a primitive script if you run the attached example but you will have to adapt this for any other calculation). An explanation of the format is below. If phonopy detects symmetries in your system you don’t have to add all atoms in the BORN file – this can be tested by running phonopy with the -v key and check which atom has an asterisk. In this particular case all (12) atoms have to be added.


B) moving on to phonopy we need a PWSCF scf input file (which I named scf.in) and ask phonopy to create all displacements (which phonopy calls supercell-XXX.in) This is done by invoking

phonopy –qe -d –dim=”1 1 1″ -c scf.in -v

The options used here are –qe (using PWSCF), -d (create displacements) –dim=”1 1 1″ (the supercell has the same dimension as the original one since we are working with a vacuum box), -c scf.in (read the crystal structure from scf.in) and -v (verbose). The output will look something like


-------------------------------- super cell --------------------------------
Lattice vectors:
a 19.314090000000000 0.000000000000000 0.000000000000000
b 0.000000000000000 19.963010000000001 0.000000000000000
c 0.000000000000000 0.000000000000000 15.000000000000000
Atomic positions (fractional):
*1 C 0.43756745800000 0.53539552000000 0.50000000000000 12.011 > 1
*2 C 0.43711714400000 0.46541472000000 0.49999999900000 12.011 > 2
*3 C 0.50045009500000 0.56998119400000 0.50000000200000 12.011 > 3
*4 C 0.56285932100000 0.53460011500000 0.50000000300000 12.011 > 4
*5 C 0.56240056200000 0.46462296300000 0.50000000200000 12.011 > 5
*6 C 0.49952532300000 0.43003191600000 0.49999999900000 12.011 > 6
*7 H 0.38890741900000 0.56298252000000 0.50000000200000 1.008 > 7
*8 H 0.50083046500000 0.62454308600000 0.50000000200000 1.008 > 8
*9 H 0.38810367000000 0.43842476300000 0.49999999900000 1.008 > 9
*10 H 0.49916408600000 0.37546922500000 0.50000000000000 1.008 > 10
*11 H 0.61188283800000 0.56157435100000 0.50000000400000 1.008 > 11
*12 H 0.61105911200000 0.43703670400000 0.50000000300000 1.008 > 12
----------------------------------------------------------------------------
"phonopy_disp.yaml" and supercells have been created.


and as mentioned above all atoms with an asterisk need to be included in the BORN file. At the same time phonopy will have created a series of displacements (48 in the case of benzene) which all contain only the displaced geometry but not the other input cards (&control, .. etc). The easiest way to use these is to append them to a “PWSCF template” of sorts and just add the coordinates. Then one has to run single-point force calculations using pw.x for each file which can be done at any hybrid exchange-correlation functional that is currently available – neat! Once those are done phonopy can collect the forces from all the separate out-files by using

phonopy –qe -f supercell-{001..048}.out –nac

This will create a file called FORCE_SETS and it will read the BORN file to add the “non-analytical correction” (–nac).

To check the phonon frequencies one can easily grep “frequency” from the mesh.yaml file which in this particula case will look like

 frequency: -0.8565677184
frequency: -0.4716156352
frequency: -0.3672091881
frequency: -0.0000013963
frequency: -0.0000008147
frequency: -0.0000002343
frequency: 16.2961123012
frequency: 16.3088957474
frequency: 24.8072360316
frequency: 24.8201310171
frequency: 27.2807808008
frequency: 29.0709809006
frequency: 34.4192607530
frequency: 34.5190166527
frequency: 39.4455527017
frequency: 39.5271778453
frequency: 40.6711523243
frequency: 40.9449176736
frequency: 41.1184463866
frequency: 42.6869160485
frequency: 42.7228524891
frequency: 47.0752882284
frequency: 48.0036987657
frequency: 48.0300599224
frequency: 55.1675013606
frequency: 55.3599357594
frequency: 60.4965619592
frequency: 60.5350132184
frequency: 65.5797175182
frequency: 65.5925203426
frequency: 127.3836904483
frequency: 127.7387235024
frequency: 127.8205031638
frequency: 128.3666018221
frequency: 128.4551561033
frequency: 128.8032547943


negative frequencies are imaginary modes. If they are small enough (here all less than 1 THz ~ 4 meV) one can ignore them, if they are large the structure was probably not sufficiently relaxed or the calculation was not converged in terms of the cutoff, vacuum box size, ..). With the phonopy-spectroscopy code one can also easily calculate nice (broadened) infrared spectra with one simple line:

phonopy-ir –linewidth=16.5 –spectrum_range=”0.0 4000″

For visual comparison of many spectra this is very convenient so check it out!


Finally here it is: the spectra of benzene using different exchange-correlation functionals compared to experiments (from the NIST database) and the DFPT results.


Was this post helpful or am I missing something? Please let me know in the comments or via mail!


To reproduce the results just run the attached run.sh file. Have fun! run_phonopy_qe.zip


Band structure calculations in QE using hybrid functionals

In recent years the interest in hybrid functionals (that is the incorporation of parts of Hartree-Fock exchange in calculations based on common approximations of exchange-correlations such as LDA, GGA and so on) has steadily increased owing to its improvement over most common functionals, especially when it comes to band-gap calculation of extended solids – see for example this work for a comparison. Quantum Espresso now offers a variety of hybrid functionals (for a complete list see the header of funct.f90) but currently the code can only use hybrid functionals for self-consistent calculations. The reason being that:
The problem is quite fundamental, because in order to get the Fock operator at a certain k-point you need the wavefunctions on a grid that is commensurate with it, this can only be done self-consistently. (L. Paulatto)
But there is a quite elegant solution via maximally localized Wannier functions. If you worked with wannier functions before you know they required the “full grid” (conveniently generated using the tool kmesh.pl) but a recently introduced tool allows to “unfold” the SCF calculation of the reduced grid to the full grid using the executable open_grid.x. An example is provided with recent versions of QE as well. In the following I will use this approach to improve the band-gap of MgO. Using PBE pseudopotentials the band-gap is underestimated at about 4.3 eV but using the HSE hybrid the band-gap can be improved to about 7 eV, which is within acceptable range of the experimental value of ~7.7 eV. The workflow is fairly straightforward:
  1. run a (converged) SCF calculation with input_dft=’HSE’ and a number of empty bands. You have to ensure convergence with respect to the usual parameters (k-points, cutoff, …) AND the mesh for the Fock operator (nqx)
  2.  unfold the reduced grid onto the full grid using open_grid.x
  3.  wannierize the obtained wave-functions using wannier90.x and plot the band-structure along a desired high symmetry path
The wannierization is by far the most tricky part in this particular example but by projecting on O:p and Mg:s one can accurately describe  the valence band and an additional single conduction band. For the resulting band-structure see the figure below.
Figure 1. Comparison of the band-structure of MgO on PBE level (purple) and the corresponding wannierzation (grey) as well as the final HSE hybrid calculation with vastly improved band-gap of 7.4 eV (blue)
So this is actually quite straight-forward. please note that in above calculation the Fock operator was calculated on a very coarse 1x1x1 grid. The calculation on such a coarse grid actually seems to over-estimate the band-gap and a converged energy can be obtained on a 6x6x6 nqx grid with ~6.7 eV. The entire calculation can be run using the attached script – I hope you find it helpful!

From “Fatbands” to Wannier Functions of Silver

Electronic bands – the energy solutions εi(k) of the Kohn-Sham equation of a non-interacting electron in an effective potential, are, despite of approximations made in practical DFT calculations, very successful in describing the physics of condensed matter. It is sometimes necessary (or simply practical) to describe the band-structure (“Spaghetti”) in terms of local orbitals, that is in a language that is more close to the “chemist’s picture” of atomic s,p,d orbitals. Generally, the s,p,d nomenclature is linked to the angular momentum l of a radially symmetrical potential (“Hydrogen model”) – and not a periodic crystal potential. It can be shown, however, that the resulting electronic bands can often be assigned to a certain l, at least for the low-energy core bands.

Most programs available allow to obtain this information either as a function of energy alone (the  density of states, DOS and projected density of states, PDOS) or resolved in energy and crystal momentum which is often called a “fat-band” representation as the weight of the orbital s,p,d characteristic is shown as the line thickness for practical reasons.  As a simple example I have calculate the PDOS of bulk silver using the ELK code, a full-potential (all-electrons) linearised augmented-plane wave (FP-LAPW) DFT code. The relevant task numbers in this case are 0 (the ground-state), 10 (the total and projected density of states) and 21 which the manual lists conveniently to give us the Band structure plot which includes angular momentum characters for every atom. Details can be found in the attached elk.in file.

fatbands_ELK_Ag

The figure shows the band structure on the left-hand side and the corresponding integrated information with the same color-code on the right-hand side. I included arrows to highlight how certain features in the PDOS can be interpreted based on the band structure and vice versa. The first thing to notice is that most bands above the Fermi level (set as 0 in the ELK code) are a mix of various l-states whereas just below the Fermi level the d-states form a fairly flat (localized) set of bands.

Now I usually work with the plane-wave pseudopotential method as implemented in Quantum-Espresso (QE 6.3) and not with full-potentials but I chose above calculation as an entry point to show what can be a problem with pseudopotentials – bear with me. Turning to QE I generate the same input structure as previously used in ELK using cif2cell with the program switch -p pwscf. I use my favorite set of norm-conserving pseudopotentials from the ONCV library and generate the wave-functions using the latest version (3.3.1) of the ONCV code. For silver I find that a regular k-point grid of 11x11x11 and a cutoff of the wave-functions of about 80 Ry gives converged results. The calculation of fatbands is a bit more difficult in QE than ELK and involves the following steps:

  1. calculation of the band-structure using pw.x and bands.x
  2. calculation of the “projection on wave-functions” using projwfc.x
  3. generation of the weights by calculating the overlap between projections and wave functions using plotband.x

All steps are automated in the bands.sh script attached but I want to highlight that the setting of  lsym=.true./.false. in the input for bands.x and projwfc.x is important. When the projection file is found by plotband.x it asks for a list of wave functions to calculate the overlaps. The proper numbers can be found in the output of projwfc.x and looks something like

state # 1: atom 1 (Ag ), wfc 1 (l=0 m= 1)
state # 2: atom 1 (Ag ), wfc 2 (l=1 m= 1)
state # 3: atom 1 (Ag ), wfc 2 (l=1 m= 2)
state # 4: atom 1 (Ag ), wfc 2 (l=1 m= 3)
state # 5: atom 1 (Ag ), wfc 3 (l=0 m= 1)
state # 6: atom 1 (Ag ), wfc 4 (l=2 m= 1)
state # 7: atom 1 (Ag ), wfc 4 (l=2 m= 2)
state # 8: atom 1 (Ag ), wfc 4 (l=2 m= 3)
state # 9: atom 1 (Ag ), wfc 4 (l=2 m= 4)
state # 10: atom 1 (Ag ), wfc 4 (l=2 m= 5)

The ordering here is the same as in the pseudopotential file, so in case there is any doubt consult the header of the pseudo and confirm the valence configuration:

#n l occ
4 0 2.00
4 1 6.00
4 2 10.00
5 0 1.00

The following figure shows the fatbands as obtained by QE and the band structure obtained from maximally localized wannier functions (MLWF) via wannier90.

bands-wannier_ONCV_QE

If you are familiar with wannier90 you know that the definition of an initial “guess” of wavefunctions is usually critical in order to obtained well localized wannier functions. Looking at the fatbands of QE the character of the bands just above the Fermi level remains, unfortunately a mystery. Overall the band-structure agrees very well with the results obtained from ELK which tells us that the pseudo has no problem but the wave functions generated with ONCV are less than perfect. If I had read the release notes carefully I would have been able to expect this:

The upf output now includes pseudo wave funtions for the occupied states.
This will allow LDA+U calculations in some codes. Please note that
ONCVPSP potentials have not been tested or benchmarked for this use.
Also be aware that LDA+U is a semi-empirical mean field theory, and
does NOT represent many-body physics.

Ultimately I had no problem defining proper projections (with the guidance of the ELK fatbands) but above should be kept in mind when performing, for example, LDA+U calculations in QE (note that this does not really pose a problem here as the highest-l manifold, the d-bands, have proper wave-functions!).

For wannier90 initial projections of

begin projections
Ag: s;p;d
end projections

result in an average spread of Ω~1.1 per atom which is fairly well localized and the resulting tight-binding bands agree well with the DFT bands, as can be seen on the right-hand side above.

Hope this was helpful – if there is any problem running attached scripts please leave it in the comments!


PS: as correctly mentioned in the comments, a “better” pseudopotential would be able to produce a more accurate fat-band representation. Therefore I attached a small comparison of 3 easily available PPs (from the PSLibrary, the GBRV library and ONCV library) – an updated “run script” is attached as well. HTH!

comparison_Ag_pseudos

fatbands_Ag

Ag_bands_comparison.sh


Work function calculation of MgO in QE 6.2.1

Using a slab-vacuum system and the dipole correction as previously described we aim to calculate the work-function (WF) of MgO. The experimental value for the WF of a low-index surface such as (200) is about 5 eV according to Choi et al.

pwi2xsf

By constructing a 6 layer MgO slab padded by 6 layers of vacuum we create an artificial surface that is infinitely repeated by periodic boundary conditions. The dipole correction is applied by setting tefield and dipfield to true. We know that the position of the dipole is critical as the discontinuity has to fall into the vacuum region. By moving the dipole across the vacuum region it can be shown that if the dipole is too close to the slab the dipole correction will fail.

pot-1

If placed correctly the electrostatic potential will be flat in the vacuum region. Two failing cases are also shown by dashed lines. The slab is repeated to the negative region to emphasize the region in which the dipole correction is physical which extends from emaxpos+eopreg-1 (in units of entire cell extending from [0-1]). The difference between vacuum level (here set to 0) and the flat region of the electrostatic potential is about 5 eV which is in acceptable agreement with experiment. Find the script to run this job here.


Dipole correction in Quantum-Espresso

For surfaces that have a non-vanishing dipole density quantum-espresso (QE) offers a dipole correction in combination with the sawtooth potential. The relevant variables in the pw.x input are dipfield and tefield, which both have to be set to true. Unfortunately this is not all there is to do – we also have to define where the dipole is located and the location (and size) of the dipole play an important role. Since this confuses me regularly I decided to write it down here in the hope it helps me and others.

Lets assume we have centered the slab in the center of our cell and the cell extends from 0 (the bottom) to 1 (the top). As QE uses periodic boundary conditions everything that exceeds the length of the cell will re-enter the cell at the bottom, i.e. (1+x)=x in relative z-coordinates. As the manual tells us one has to take care of 3 parameters: emaxpos, eopreg and eamp. Since we only want to apply a dipole correction the amplitude eamp=0. The field linearly increases until emaxpos and then decreases to reach 0 at emaxpos+eopreg, as such they represent the positive and negative charges that create the dipole. It is important that the change of slope, that is emaxpos, lies in the vacuum region and so must emaxpos+eopreg (the opposite charge) – otherwise the correction will not work. A very useful setup is to center the slab in the cell (~0.5 in relative z-coordinates) and the dipole around 0 of the slab. One can then slowly increase the length of the dipole and see if the resulting electrostatic potential (plot_num=11 in pp.x) becomes flat in the vacuum region (thanks for Dr. Thomas Brumme for the hint!). As long as the dipole and the charge density of the electrons do not overlap the correction works and the necessary amplitude of the dipole field decreases linearly with the dipole length – as to be expected since p=q*z (see the right side of Figure 1). When the dipole gets too close the correction fails and the potential is no longer flat in the vacuum region. Please note that this does not mean that SCF convergence cannot be reached – in fact, the last case converges faster than all the cases were the results are physically meaningful in this particular case.pot-1

Figure 1. Potential as obtained by pp.x (plot_num=11) and averaged in xy-plane (average.x) as a function of the dipole length with the dipole centered at 0 of the cell. On the right side the amplitude of the dipole field is shown as function of the dipole cell.

In recent versions of QE a different correction has been implemented by Sohier et al. as well. This is activated with the input-flag assume_isolated =’2d’ and gives basically the same result. As an advantage the new correction seems to be working better with phonons of 2-dimensional systems but not all codes that build on QE output are able to read it yet (for example the resulting electron-phonon matrix elements in EPW are too large by a factor of at least 100).

Attached shell script will run a calculation for dipoles of varying length – by collecting the results one can reproduce above figure.

Hope this was helpful – if not, let me know in the comments!

run